
fintechzoom.com is a financial media and data aggregation website that compiles real-time stock market metrics, cryptocurrency prices, global indices, and commodity charts. The platform provides retail investors, small business owners, and tech startups with immediate visibility into global financial shifts without requiring subscription-based terminal software. I view platforms like this as essential bridges between complex institutional feeds and everyday market participants. Instead of managing expensive data contracts, you can use these public dashboards to track macroeconomic trends, assess cryptocurrency volatility, and follow corporate earnings. However, using these sites effectively requires understanding how they source their data, where they fit in your business workflow, and how to verify the accuracy of their reports.
What assets and indices are covered on the platform
The platform aggregates public feeds across several major financial sectors. Rather than focusing on a single niche, it centralizes disparate asset classes into unified dashboards. This is especially useful if you need to monitor how different markets react simultaneously to macroeconomic catalysts. The core coverage areas include:
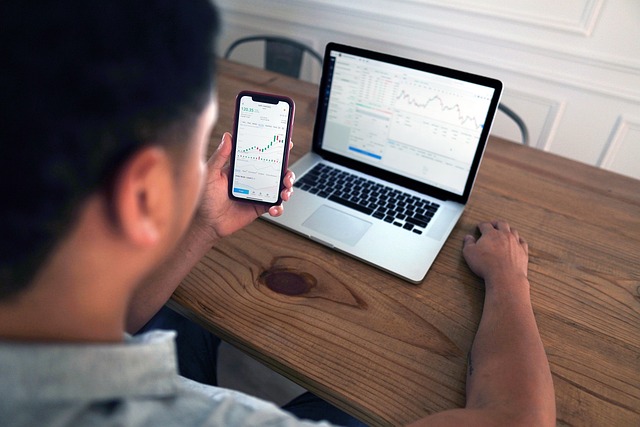
- Global Indices: Real-time tracking of major market benchmarks, including the Nasdaq Composite, the S&P 500, the Dow Jones Industrial Average, the STOXX 600, and Japan’s Nikkei 225. For instance, you can observe how a global index rebound plays out across different continents during volatile trading periods.
- Cryptocurrency: Live updates on high-volume digital assets such as Bitcoin and Ethereum. The site captures price movements, volume changes, and basic trading indicators.
- Commodities: Spot prices for gold, silver, crude oil, and other industrial metals. This section is often used by businesses tracking manufacturing supply chain costs.
- Corporate Equities: Individual stock tickers, focusing heavily on high-growth technology companies and market leaders like Nvidia, alongside institutional stake movements.
Comparing financial tracking platforms
To understand where fintechzoom.com fits into the broader market ecosystem, it helps to compare free public aggregators against dedicated institutional terminals and standard free news portals:
| Platform Type | Primary Audience | Data Speed & Precision | Cost Structure | Best Business Use Case |
|---|---|---|---|---|
| Free Public Aggregators (e.g., fintechzoom.com) | Retail investors, startups, small business managers | Aggregated public feeds, standard refresh rates | Free / Ad-supported | Macroeconomic tracking, supply chain cost monitoring, basic market sentiment |
| Standard Free Portals (e.g., Yahoo Finance, Google Finance) | General public, casual portfolio trackers | Public exchange feeds, occasional 15-minute delays | Free with premium tiers | Personal watchlist tracking, general news sentiment |
| Institutional Terminals (e.g., Bloomberg, Refinitiv Eikon) | Hedge funds, quantitative traders, corporate treasurers | Sub-millisecond direct exchange feeds | Paid enterprise subscription | Direct order execution, complex quantitative modeling, liquidity analysis |
Interpreting live market and index updates
When you monitor live updates on the platform, you are looking at aggregated feeds compiled from public stock exchanges and liquidity providers. A classic example of these interactions occurred on October 3, 2026, when weak U.S. jobs data triggered an unexpected rally in global equities. According to report data from Beinsure, the Nasdaq gained 1.2% during this period, leading a global stock index rebound that also lifted the S&P 500 and the STOXX 600. If you are watching these updates on fintechzoom.com, you can observe these correlations in real time. A sharp drop in labor market strength often signals to investors that central banks might cut interest rates, which frequently pushes tech-heavy indices upward. Tracking these specific cause-and-effect relationships on live charts helps you make informed decisions about your business’s financial planning or capital allocation.
Worked example: Translating market shifts into operational actions
Consider a hardware tech company that relies on silver for component manufacturing and crude oil for overseas freight shipping. Here is how an operational manager uses public dashboard tracking to act on market movements:
- Observation: During a regular market review, the manager notices a sharp multi-day increase in crude oil spot prices alongside rising inflation discussions on market news feeds.
- Analysis: Sustained increases in oil prices typically lead to carrier shipping surcharges within two to three weeks. Meanwhile, major technology indices show increased volatility due to macroeconomic uncertainty.
- Action: The manager places advance orders for the upcoming quarter’s inventory before shipping carriers adjust their surcharge rates, successfully locking in lower transport costs and protecting operating margins.
Evaluating data reliability for business decisions
If you are running a startup or managing a corporate budget, you might wonder whether a free platform like fintechzoom.com is reliable enough for professional workflows. I believe the answer depends entirely on the speed and precision your business requires. For high-level planning, such as tracking whether rising silver prices will impact your hardware manufacturing costs or monitoring overall market sentiment, the data is perfectly adequate. It provides a reliable broad-stroke view of where the market is moving. However, for high-frequency trading, automated treasury management, or algorithmic execution, free public sites are not suitable. They lack the sub-millisecond precision and direct exchange pipelines found in dedicated institutional tools. In addition, public dashboards must normalize massive volumes of unstructured data from varying global exchanges. When you design your own internal tools to parse these kinds of financial feeds, maintaining structured standards is critical.

Who this platform is NOT suited for
While public market portals provide high utility for broad market visibility, certain workflows demand specialized tools rather than web-aggregated data:
- High-Frequency Traders (HFT): Automated trading algorithms requiring sub-millisecond execution cannot rely on web-based aggregated dashboards due to network latency.
- Corporate Treasurers Executing Large FX Conversions: Multi-million dollar currency transactions require firm, executable quotes directly from institutional liquidity providers to avoid slippage costs.
- Compliance and Audit Officers: Formal financial disclosures and regulatory reporting require certified historical logs obtained directly from official exchange feeds or regulatory databases.
How to incorporate market tracking into your business operations
For startups and small businesses, staying aligned with macroeconomic trends is a protective measure. You do not need a dedicated finance department to keep an eye on variables that impact your runway. I recommend setting up a structured weekly review process to keep your team informed. Start by identifying the specific metrics on fintechzoom.com that directly correlate with your business costs. If your startup relies on cloud infrastructure, monitoring tech indices like the Nasdaq can give you an early indication of venture capital sentiment and industry valuations. If your business model involves physical goods, monitoring oil and commodity spot prices will help you anticipate shifts in shipping and material costs. I suggest assigning one team member to note these indicators at the close of every trading week. Recording these numbers consistently will help you spot long-term patterns, allowing your leadership team to adjust budgets or secure materials before pricing shifts hit your bottom line.
Step-by-step implementation process
- Step 1: Map Core Expenses to Tickers: Connect key business costs to relevant market metrics. For example, map tech sector health to the Nasdaq Composite, energy expenses to WTI crude oil, and import costs to major foreign exchange pairs.
- Step 2: Log Weekly Benchmarks: Designate a staff member to record Friday closing prices for selected metrics in a central internal dashboard.
- Step 3: Define Threshold Triggers: Establish clear operational rules. For instance, if key material prices move by more than 5% over two consecutive weeks, trigger a supplier price review.
- Step 4: Verify Executable Quotes Prior to Major Commitments: Before executing large commercial transactions or inventory orders based on public trends, confirm actual spot quotes with your primary vendors or brokerages.
Common challenges when using free financial aggregators and how to resolve them
When relying on public web dashboards for market context, organizations occasionally run into specific operational hurdles. Understanding how to manage these issues ensures smoother decision-making:

- Challenge: Data Latency and Feed Delays. Public dashboards may reflect slight feed delays depending on exchange data licensing agreements.
Fix: Use public portals for broad sentiment and directional tracking. For order execution, rely directly on primary trading accounts or direct exchange feeds. - Challenge: Conflicting News Headlines. Financial news portals host dynamic headlines that can overemphasize short-term intraday market movements.
Fix: Focus on multi-week trendlines rather than reacting to temporary daily fluctuations. Verify corporate announcements against regulatory filings such as SEC disclosures. - Challenge: Currency Discrepancies Across International Markets. Asset prices sourced across different international exchanges can vary based on local exchange rates and trading hours.
Fix: Convert and record all monitored prices into a single base operational currency (such as USD) when logging metrics for team review.
Frequently asked questions
Is fintechzoom.com free to use?
Yes, fintechzoom.com operates as a publicly accessible financial news and market tracking portal that does not require subscription fees or terminal software.
Can I trade stocks or commodities directly on fintechzoom.com?
No, the site serves purely as an informational dashboard and financial news aggregator. To execute market orders, you must use a regulated brokerage or exchange service.
How frequently are price tickers updated on the platform?
The platform displays live market indicators sourced from public exchange feeds. While prices refresh continuously during trading hours, public feeds may experience minor latency compared to direct institutional execution terminals.
Why do small businesses track indices like the Nasdaq Composite?
Tracking major tech indices helps founders gauge broader tech sector valuations, market sentiment, and venture capital liquidity, offering advance indicators for funding environments and tech infrastructure costs.